Report: Worldcon Membership Demographics, 2001-2020
René Walling
QuébecSF
Author Note:
Correspondence concerning this report should be addressed to René Walling.
Contact: [email protected]
Purpose
This report is a continuation of the work done in Worldcon Membership Demographics, 1939-1960 (Walling, 2016) and in Worldcon Membership Demographics, 1961-1980 (Walling, 2018) and Worldcon Membership Demographics, 1981-2000 (Walling, 2019) and aims to see if any of the trends previously observed continue in subsequent Worldcons and provide some hard data on the membership of the Worldcons of that period.
Methodology
Fundamental Membership Data
The membership lists published in the World Science Fiction Conventions (hereafter “WSFC”) sources for any given Worldcon, which consist of progress reports, program books, and websites, were compiled in one database indicating each person’s name and the Worldcon(s) of which they were a member. In addition, membership lists from the registration records were used for several years (2007, 2008, 2009, 2013 and 2015). All data sources used are listed in Appendix A in chronological order by Worldcon.
Since the names listed in the progress reports and program books are only for those people who registered ahead of time, it is thus to be expected that the total number of names from WFSC sources does not match the total membership as reported in the Long List of World Science Fiction Conventions (hereafter the “Long List”), also referenced in Appendix A. In addition the Long List is based on a variety of documents, mostly convention publications, and most fans reporting on Worldcons at the time focused on the number of attendees – people who were physically present at the convention, not the number of members – people who purchased memberships to the convention in order to receive its publications by mail and enjoy other benefits of membership. It is also important to note that, for the same reason, the sample studied is not randomized.
Repeat Members
For data analysis spanning multiple Worldcons, the assumption is made that a name that appears in different membership lists always refers to the same person.
Obvious “joke” names are eliminated and multiple known pseudonyms for the same person appearing in a single Worldcon’s membership list are eliminated for the purposes of this study.
Gender identification
Gender determination based on name is commonly used to extract the otherwise unavailable data from lists of names. Three different methods were used to do so. For all of them, gender was first assigned based on honorifics. In addition, members who only had first name initials listed, as well as organizations and other non-human entities were assigned a gender of “Other.”
Method 1. The first method consists of consulting several websites (Behind the name, n.d.; Meaning of names, n.d.; Names, n.d.) on the meaning of names and assigning gender according to the gender listed in the website. In the case of names unlisted in any of these sites “Other” was selected as the gender. The same was done with gender-neutral names.
Method 2. The second method is to run the list of names through the Genderize.io (Genderize, n.d.) application-programming interface (API.) Since Genderize provides a probability factor for the gender of each name, this can be used to assign a weighted estimate for gender-neutral names. Names where the API returned a result of “null”, meaning they are not in the database consulted by the API, were labeled “Other”. If the gender of a specific person is known, it was assigned a probability of 100%, regardless of the result given by the API. The advantage of this method over method number three outlined below is that genderize.io incorporates not only first names, but also common nicknames, e.g. Jim, Pat, Liz, etc….
Method 3. The third method is to do a statistical analysis using the genderdata package (Mullen, 2015) for R (a statistical analysis software.) In addition to assigning a weighted estimate for gender-neutral names, like the Genderize.io API, it also takes the estimated year of birth of each person into account. The downside is that for the time period concerned only data for the United States is available. This is mitigated by the fact that the large majority of Worldcon members at the time were from the U.S. This detail is supported by the souvenir books of those Worldcons publishing membership maps. For year of birth, the package can provide a gender estimate for a range of years; it was assumed that members registered for their first Worldcon between the ages of 18 and 40, inclusively. Again, if the gender of a specific person was known, it was assigned a probability of 100%. If the package did not return any results, meaning a name was not in the database consulted, it was assigned a gender of “Other”.
Results
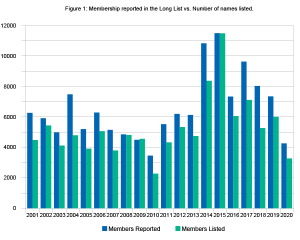
The number of members listed over the entire 2001-2020 time span totals 105,284 for the WSFC sources, which represents 80.42% of the total from the Long List (130,917). The total number of individual members is 49,248.
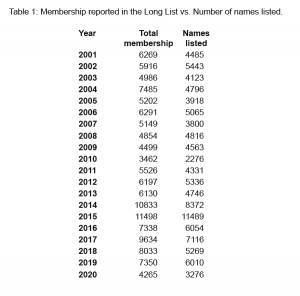
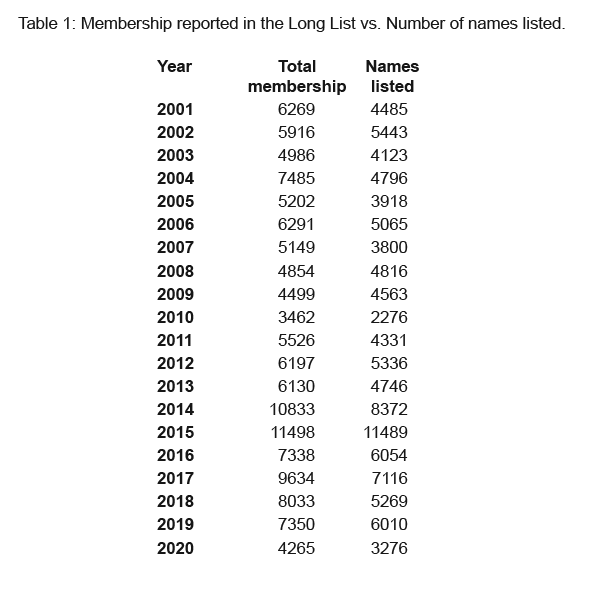
Table 1 presents membership data for every Worldcon held between 2001 and 2020 inclusively. The first column shows the number of members according to the Long List. The second column shows the number of members compiled for this report from WSFC sources.
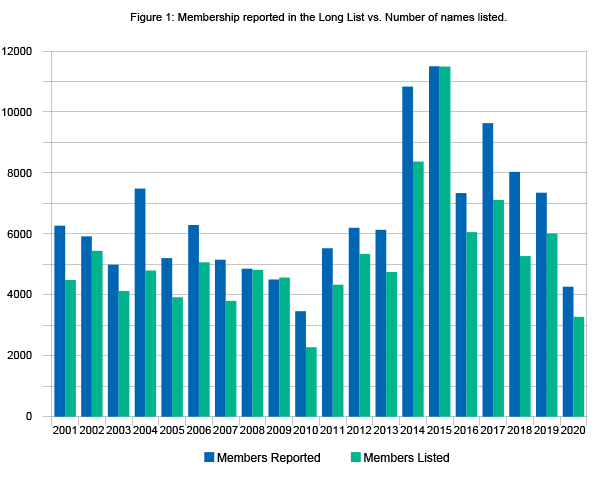
Figure 1 compares the yearly totals of the WSFC data (Column 2 of Table 1) to those of the Long List (Column 1 of Table 1). What can be seen is that the membership seems stable, continuing the trend seen in the previous report (covering 1981-2000), for the first decade in this period with only one convention having more than 7000 members and one with less than 4000, and no clear trend either upwards or downwards. The second decade surveyed shows a marked increase in membership with six conventions having more than 7000 members, including four with more than 8000 members and two conventions having less than 6000 members, none with less than 4000. The year with the smallest proportion of names listed are 2004, 2010 and 2018, all with about 65% of the membership as reported in the Long List.
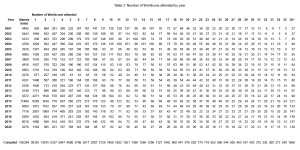
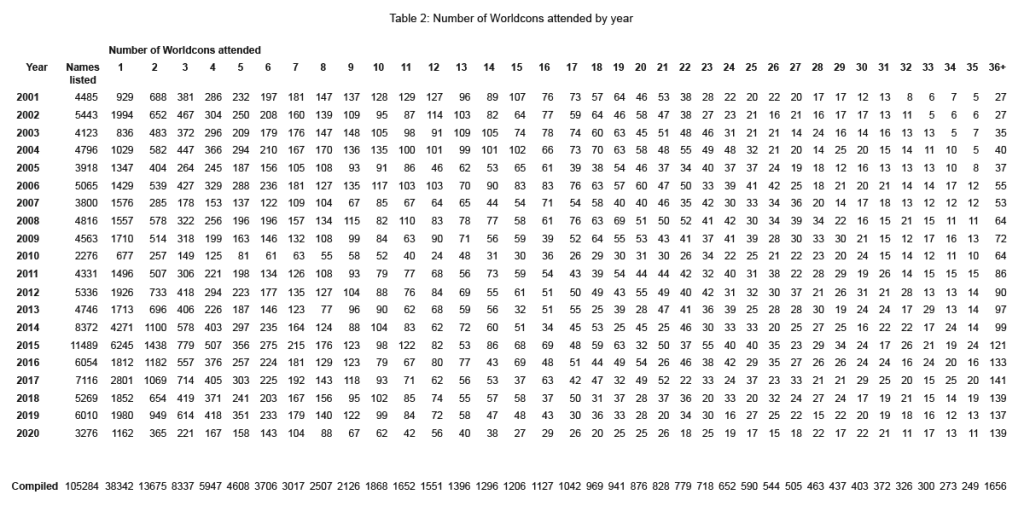
Table 2 details the same WSFC data as a function of the number of Worldcons attended up to that point in time by members each year. We can then compile these numbers to know how many people attended only one Worldcon in the period surveyed, how many attended two, and so on. The individual members of each Worldcon are compared across time, and if a member is listed in a preceding Worldcon, that member is classified as a returning member and as having attended multiple Worldcons. Note also that Table 2 takes into account Worldcons attended between 1939 and 2000.
The compiled results, shown in the last line of Table 2, shows that a large majority of Worldcon members only attended a single Worldcon, and the number of returning members goes down rapidly as the number of Worldcons attended increases and seems to follow an inverse logarithmic curve.
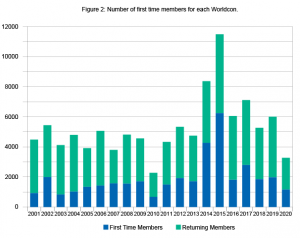
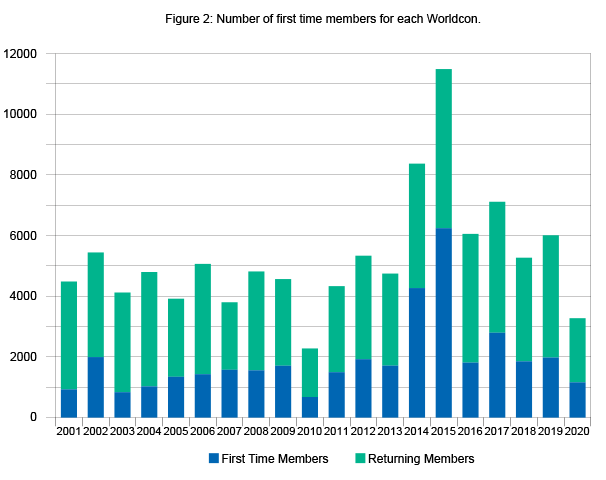
Figure 2 compares the number of first-time members (Column 3 of Table 2) to the total of the WSFC data (Column 2 of Table 2).
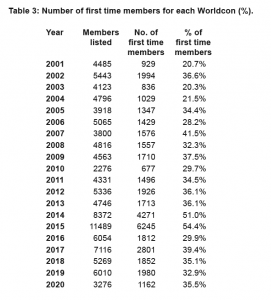
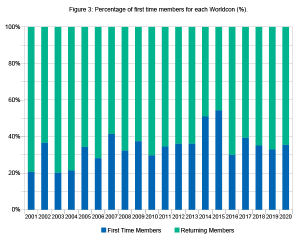
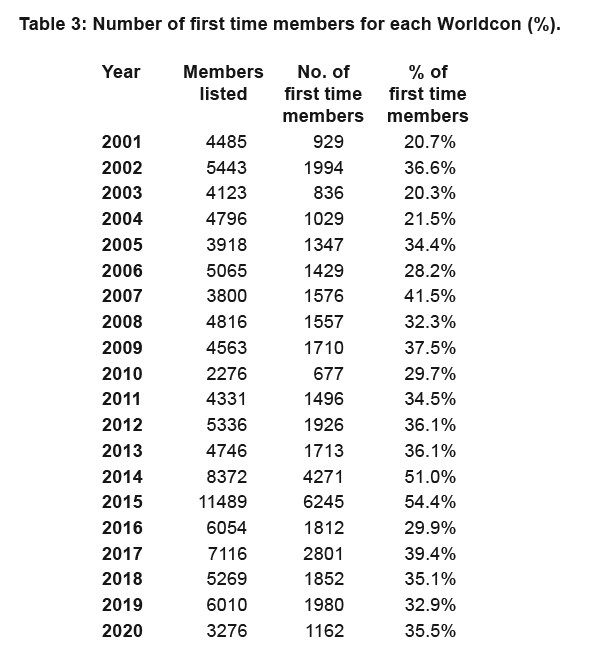
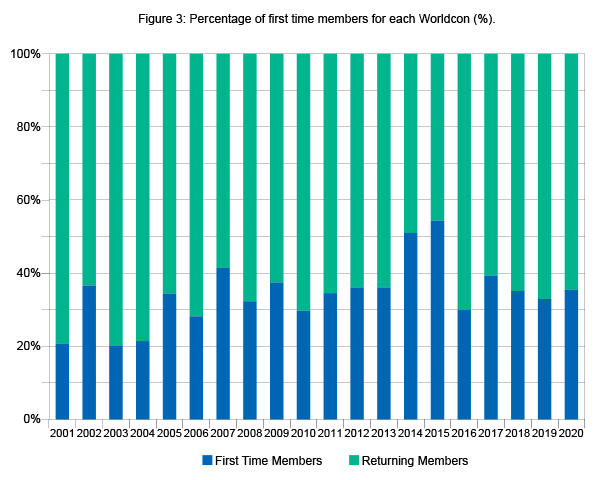
Table 3 compares first time members to the total of the WSFC data. Figure 3 shows the ratios listed in Column 4 of Table 3. Figure 3 shows the ratios listed in Column 4 of Table 3.
In Figures 2 and 3, we can immediately see that, in general, the larger a Worldcon’s membership, the more new members are reflected. The correlation coefficient between the two is high enough (0.95) to say there is a very strong relationship between the two. We also see that for the 2014 and 2015 conventions, the proportion of new members exceeds 50%, something not seen since 1984, a record-breaking year at the time.
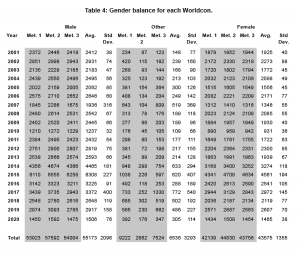
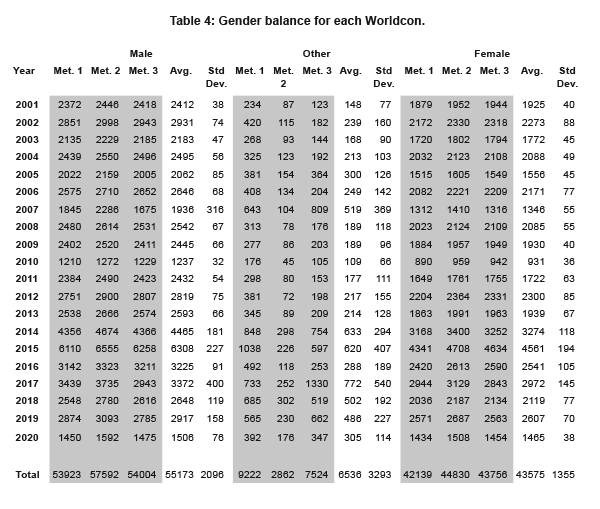
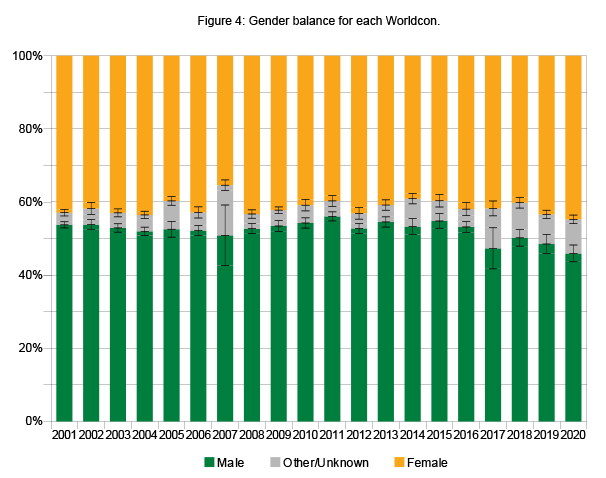
Table 4 shows the gender breakdown of each convention by year for all three gender determination methods used, as well as the averages (Columns 4, 9 and 14 of Table 3) and standard deviations (Columns 5, 10 and 15 of Table 3) for each value. The values given by the three methods are statistically close enough to be able to average them and use the minimum and maximum values as the margin of error on the results.
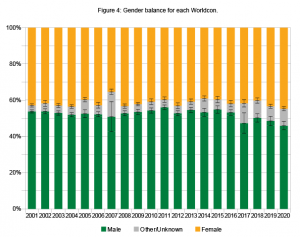
Figure 4 shows the gender balance by year using this average. As in the previous period surveyed, there is no clear overall trend, except, perhaps, the start of a decrease in male members in the last three to four years surveyed. In addition, two conventions stand out with a larger proportion of members with a gender designated as “Other”: 2007 and 2017. It is worth nothing that these two conventions also are the two that took place in non English-speaking countries, indicating the possible limitations of the gender determination methods. The websites consulted for method 1 do not have data for a larger proportion of non English names than for English names. Similarly, the data used to determine gender using method 3 are based on US census data and are therefore skewed towards English names.
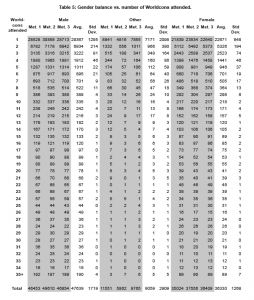
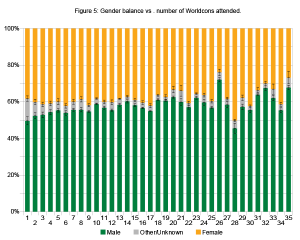
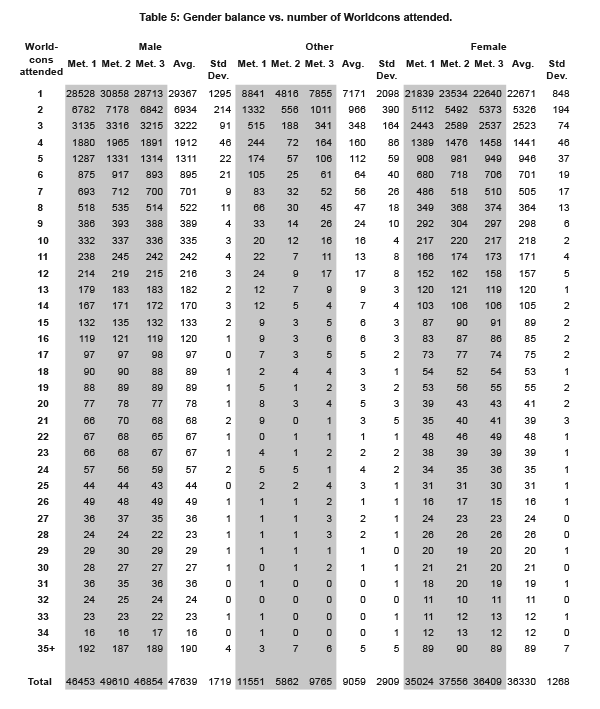
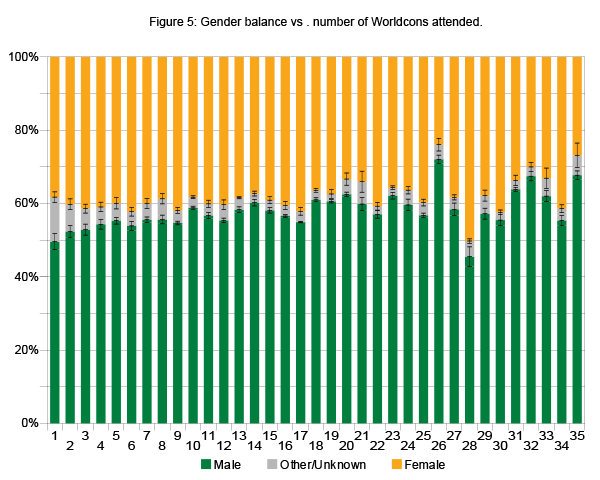
Table 5 shows the gender breakdown as a function of the number of Worldcons attended.
As the number of members who attended 36 or more Worldcons is very low, these cannot be used as a statistically significant sample, but the remaining members, i.e. those that have attended fewer conventions, can be. Figure 5 gives the same data in graph form for members who attended 35 or fewer Worldcons. The proportions remain steady for up to seventeen conventions attended. Beyond seventeen conventions attended, there is quite a bit of variation with an overall trend showing an increase in the proportion of male members.
In brief we can observe the following things:
– When compared to the previous period surveyed, Worldcon membership numbers were relatively stable, with an overall increase in the second decade surveyed.
– Like the previous period (1981-2000) gender balance seems, for the most part, to be stable.
Finally, it must be noted that the tables and charts presented reflect observations on the population of Worldcon memberships from 2001 to 2020, but do not explain on their own why any variations observed happened. In other words, they reflect the effect of events and not the cause of them. For this, further research would be needed. Questions of interest include:
– What major events in and out of fandom affected the membership of Worldcons both in terms of size and composition?
– Do what extent did the location of a Worldcon affect the size and composition of its membership?
– Does the size and composition of a Worldcon’s organizing committee bear a relationship to the size and composition of its membership?
– Does the number of program participants (panelists) and their composition bear a relationship to the size and composition of the membership of a Worldcon?
– Does the increase observed in the second decade surveyed continue in subsequent Worldcons?
Appendix A
Data sources by Worldcon year
Convention, city and year
The Millennium Philcon
Philadelphia
2001
Sources
Millenium Philcon Souvenir Book (2001, September). 160-176.
ConJosé
San Jose
2002
Retrieved from www.fanac.org/conjose/Member/memberlist.php3 (2002, September).
Torcon 3
Toronto
2003
Torcon 3 Souvenir Book (2003, September). 197-212.
Noreascon 4
Boston
2004
Noreascon 4 Souvenir Book (2004, September). 221-236 64-79.
Interaction
Glasgow
2005
Splitting Infinity, the Interaction Souvenir Book (2005, August). 136-149.
L.A.con IV
Anaheim
2006
Retrieved from www.laconiv.org/2006/reg/members.htm (2006, August).
Nippon2007
Yokohama
2007
Retrieved from www.nippon2007.us/members6.php (2007, September).
Nippon2007 Registration Records (2007).
Denvention 3
Denver
2008
Denvention 3 Souvenir Book (2008, August). 140-155.
Denvention 3 Registration Records (2008).
Anticipation
Montreal
2009
Retrieved from anticipationsf.ca/English/MembershipList (2009, August).
Anticipation Registration Records (2009).
Aussiecon 4
Melbourne
2010
AussieCon 4 Souvenir Book (2010, September). 97-105.
Renovation
Reno
2011
Retrieved from www.renovationsf.org/memlist.php (2011, August).
Chicon 7
Chicago
2012
Retrieved from www.chicon.org/membership-list.php#members (2012, September).
Chicon 7 Souvenir Book (2012, September). 145-158.
LoneStarCon 3
San Antonio
2013
Retrieved from www.lonestarcon3.org/memberships/membership_list.php (2013, August).
LoneStarCon 3 Registration Records (2015, August).
Loncon 3
London
2014
Retrieved from loncon3.org/members.php (2014, August).
Sasquan
Spokane
2015
Retrieved from sasquan.org/member-list/ (2015, September).
Sasquan Registration Records (2015, August).
MidAmeriCon II
Kansas City
2016
Retrieved from midamericon2.org/registration/members-list/ (2015, August).
WorldCon 75
Helsinki
2017
Data from WorldCon75 PR1 (2016, April). 27-31.
2017 Site Selection Data (2015, August).
Retrieved from www.WorldCon.fi/whos-coming/membership-list/ (2017, August).
WorldCon 76 in San Jose
San Jose
2018
Retrieved from www.WorldCon76.org/membership/membership-list (2018, August).
Dublin 2019
Dublin
2019
Retrieved from dublin2019.com/whos-coming/membership-list/ (2019, August).
CoNZealand
Wellington
2020
Retrieved from conzealand.nz/registrations/members/ (2020, August).
The Long List of World Science Fiction Conventions (WorldCons). Retrieved from http://www.smofinfo.com/LL/TheLongList.html
References
Campbell, M. (n.d.) Behind the name: The etymology and history of first names. Retrieved from
http://www.behindthename.com
Genderize. (n.d.) Retrieved from https://genderize.io/
Meaning of names. (n.d.) Retrieved from http://www.meaning-of-names.com/
R Core Team (2015). R: A language and environment for statistical computing. R Foundation for Statistical Computing, Vienna, Austria. https://www.R-project.org/.
Mullen, L. (n. d.). genderdata: Historical Datasets for Predicting Gender from Names. R package version 0.5.0. https://github.com/ropensci/genderdata
Names. (n.d.) Retrieved from http://www.names.org/
Walling, R (2016). Report: Worldcon Membership Demographics, 1939-1960. http://www.adastrasf.com/Worldcon-membership-demographics-1939-1960/
Walling, R (2018). Report: Worldcon Membership Demographics, 1961-1980. http://www.adastrasf.com/Worldcon-membership-demographics-1961-1980/
Walling, R (2019). Report: Worldcon Membership Demographics, 1981-2000. https://www.adastrasf.com/report-Worldcon-membership-demographics-1981-2000/


Leave A Comment